BofA Warns Two Key Breaks Could Trigger A Summer Selloff
BofA Securities’ latest Flow Show report warns that market optimism has moved into an extreme zone. For Michael Hartnett, the bank’s chief investment strategist, the summer risk trade now depends on two key levels: MAGS at $60 and AUDJPY at 110.
If either level breaks decisively, BofA believes risk assets could face a concentrated summer selloff. The warning comes as US equities just recorded their first weekly outflow in 13 weeks, while technology funds suffered their largest weekly outflow on record.
Two Lines In The Sand: MAGS 60 And AUDJPY 110
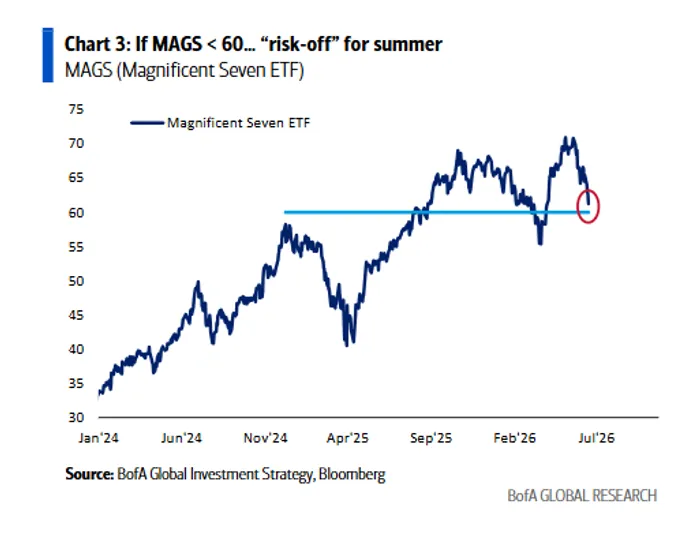
BofA identifies the Magnificent Seven ETF (MAGS) and AUDJPY as two of the most important market-sentiment gauges for the summer.
MAGS has become one of the clearest expressions of bullish positioning in mega-cap AI and technology stocks. A drop below $60 would signal that investor confidence in the largest AI-linked technology names is starting to break. That could quickly spread from mega-cap tech to the broader risk-asset complex.
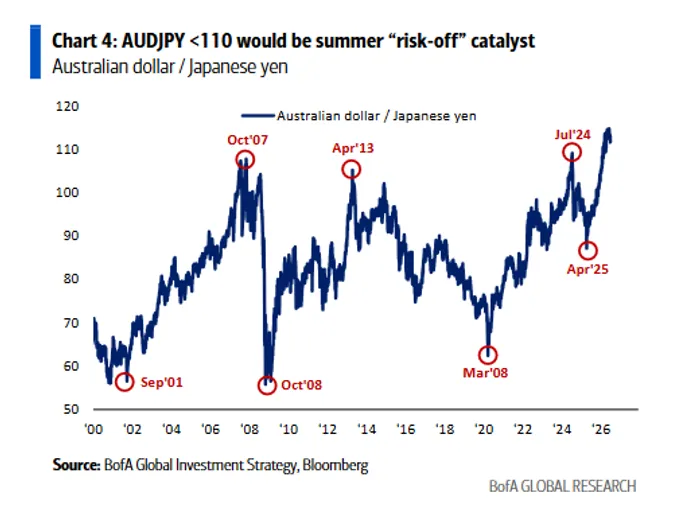
AUDJPY plays a different role. It is one of the market’s classic global risk-appetite indicators. The Australian dollar typically strengthens when global growth expectations are improving, while the yen tends to benefit when investors seek safety.
That makes 110 a critical line for AUDJPY. BofA notes that major periods of market stress, including September 2001, October 2007 and 2008, were all accompanied by sharp declines in the currency pair.
In Hartnett’s framework, MAGS below 60 would signal weakness in the AI leadership trade, while AUDJPY below 110 would signal a broader turn toward risk aversion. Together, they would be a much stronger warning that crowded bullish positions are starting to unwind.
Fund Flows Are Already Cracking
The warning is not based on technical levels alone. Fund flows are already showing signs of reversal.
US equities saw $8.5 billion of outflows this week, their first weekly outflow in 13 weeks. That came immediately after the prior week’s record $119.2 billion inflow.
The technology sector suffered an even sharper reversal. Tech funds recorded $9.3 billion of outflows, the largest weekly outflow on record, after attracting $19.2 billion of inflows the previous week.
Treasuries also saw their first outflow in nine weeks, although the amount was small at $94 million.
At the same time, money is rotating away from mega-cap technology and into smaller pockets of the market. REITs attracted $900 million, their largest weekly inflow since March 2024. Infrastructure funds drew $1.5 billion, a six-week high. Energy funds, by contrast, saw $1.5 billion of outflows, their largest weekly withdrawal since April 2025.
Bond funds remain a powerful exception. They have now recorded inflows for 61 consecutive weeks, taking in $16.6 billion this week. Investment-grade bonds, high-yield bonds and emerging-market debt all continued to attract capital.
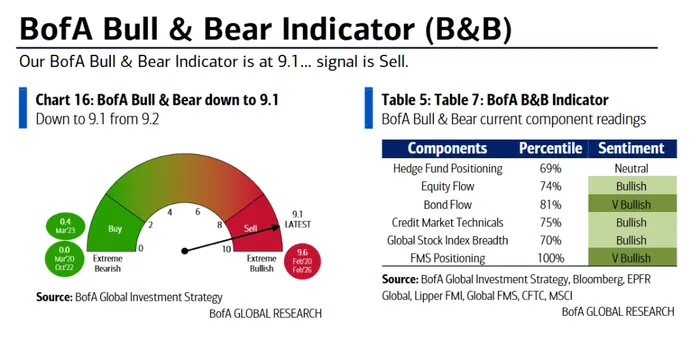
BofA’s Bull & Bear Indicator slipped only slightly, from 9.2 to 9.1, but it remains deep in the extreme-bullish zone. The sell signal that began in May 2026 is still active.
The internal components also show how crowded the market has become. Fund Manager Survey positioning is at the 100th percentile, bond inflows are at the 81st percentile, equity inflows at the 74th percentile, and credit-market technicals at the 75th percentile.
Since 2002, BofA says the Bull & Bear Indicator has generated 17 sell signals. In the two to three months after those signals, global equities fell by an average of 2% to 3%, with a hit rate of around 60%. In extreme cases, drawdowns reached 15% to 20%.
High Margins Still Support Stocks, But Risk Is Building
BofA is not saying the equity bull case has disappeared.
The S&P 500’s 16% operating margin remains one of the strongest supports for stocks. Historically, high margins have been closely associated with positive equity returns.
But the report warns that liquidity is moving quickly out of mega-cap AI technology and into semiconductors, small and mid-cap stocks, housing-related assets and REITs. BofA interprets this rotation as an early attempt to position for a shift in Trump’s policy focus toward “affordability.”
Cross-asset performance also shows how unusual the current market structure has become. Year to date, commodities are up 32.7%, emerging-market equities have gained 24.5%, and the S&P 500 is up 8%. Meanwhile, gold is down 8.1%, and bitcoin has fallen 30.5%.
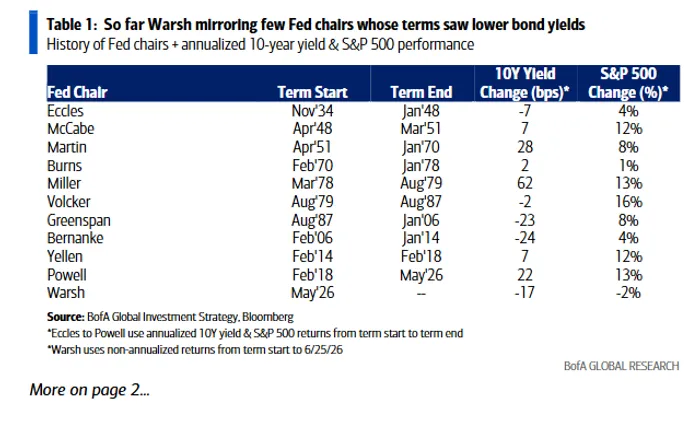
BofA also highlights a striking market pattern since Kevin Warsh became Fed chair on May 22, 2026. Since then, US Treasuries have risen 3.2%, while the S&P 500 has fallen 1.6%.
Hartnett compares Warsh with rare Fed chairs whose tenures were associated with falling bond yields, including Eccles, Volcker, Greenspan and Bernanke. Although Warsh has been labeled by markets as a “new hawk,” BofA argues that investors still have not fully abandoned the dominant “stay away from bonds” allocation view.
That is why BofA sees long-dated US Treasuries as one of the most contrarian long-term trades in the market.
For equities, the message is more cautious. High margins can keep stocks supported, but extreme optimism, record tech outflows and two fragile risk indicators mean the summer rally now has less room for error.
If MAGS holds $60 and AUDJPY stays above 110, the market may treat this as another rotation rather than a real breakdown. If both levels fail, BofA’s warning is clear: the summer selloff could arrive quickly.