Goldman Flags 5 Risks, Prepares for Dip⚠️
Five major warning signals are flashing simultaneously, and Goldman Sachs’ trading desk is actively preparing for a potential near-term pullback at the index level.
🧭 Signal 1: Hedge Funds Slam the Brakes
The first warning comes from hedge fund positioning.
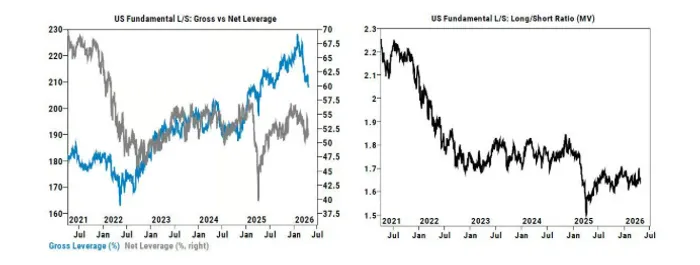
According to Goldman’s prime brokerage data, total trading activity declined last week for the first time in 13 weeks. U.S. equities saw the largest notional deleveraging in seven months (since September 2025), driven primarily by risk reduction.
Sector-wise, consumer discretionary and technology experienced the most aggressive deleveraging—ranking as the third-largest weekly reduction in the past five years.
Goldman highlights that macro short hedges have been aggressively covered, leading to a visible contraction in overall leverage. U.S.-listed ETF short interest fell another 1.4% last week, down 21.5% month-to-date, covering concentrated in credit, IT, and small-cap ETFs.
Meanwhile, hedge fund net exposure remains relatively restrained, hovering within a ±53% range, reflecting cautious risk management amid a market dominated by “unknown unknowns.”
💰 Signal 2: Record Pension Rebalancing
The second signal comes from passive selling pressure.
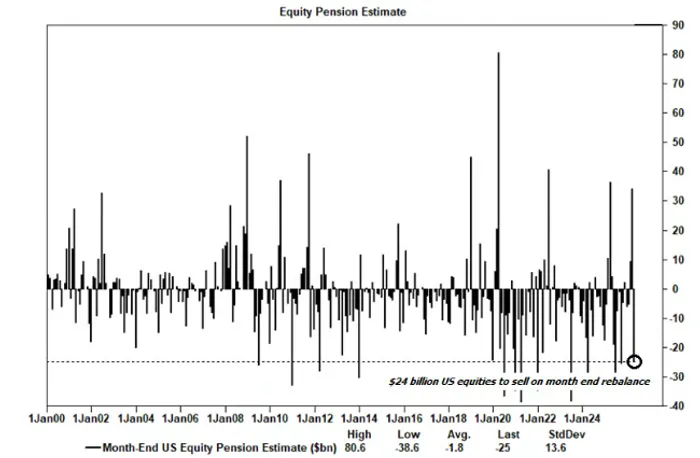
Goldman estimates that month-end pension rebalancing in April will generate ~$25 billion in U.S. equity selling, placing it among the top 15 largest sell estimates since 2000.
Excluding quarter-end effects, this would represent the largest single-month sell estimate on record. In percentile terms: 83rd percentile over the past 3 years and 92nd percentile since 2000.
This creates a mechanical supply overhang, independent of fundamentals.
🔄 Signal 3: CTA Buying Exhausted
The third warning points to trend-following strategies (CTAs).
Since April, CTAs have been one of the largest marginal buyers, purchasing roughly $53 billion in global equities, including $32 billion in the S&P 500 alone.
However, that support is now fading.
For the first time in over a month, CTAs are no longer net buyers of the S&P 500:
Slightly biased toward selling in flat markets
Likely to become significant sellers if markets decline
👉 In effect, the market is losing a key automatic stabilizer.
📉 Signal 4: Weak Breadth Behind New Highs
The fourth signal reveals structural fragility beneath index strength.
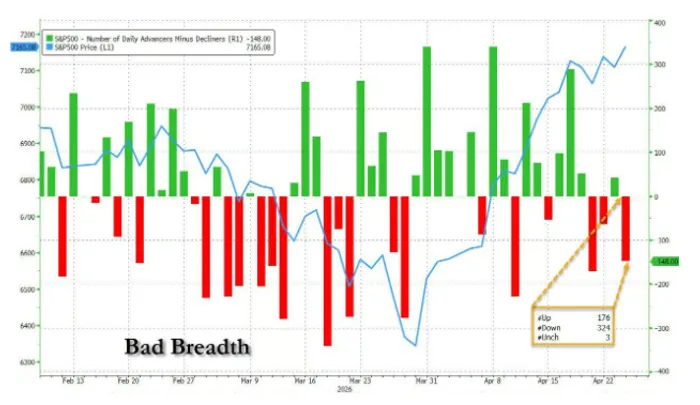
Despite the S&P 500 closing at a record high last Friday, market breadth was alarmingly weak: 324 stocks declined on the day, net breadth was -148, the second worst on record.
The only worse instance occurred in October 2025, when 80% of constituents fell despite the index hitting a new high.
👉 This level of divergence suggests the rally is narrow and concentrated in a handful of mega-cap names, historically a precursor to consolidation or correction.
🚨 Signal 5: Sentiment Stretched, SOX at Extremes
The fifth signal comes from positioning and sentiment.
Goldman’s U.S. equity sentiment indicator shows that investor positioning has entered a “stretched zone”, indicating elevated exposure levels.
At the same time, the semiconductor sector is flashing extreme signals:
SOX has risen for 18 consecutive sessions, the longest streak on record
Trading ~50% above its 200-day moving average
👉 This is the most extreme deviation since the 2000 dot-com bubble peak, when SOX exceeded its 200-day average by over 100%
⚙️ Derivatives Signal: Volatility Risk Building
In the options market, S&P 500 gamma positioning is in a rare zone.
Market makers are currently net short gamma, meaning: 👉 Any directional move in the index could amplify volatility significantly
At the same time:
Very few institutional investors hold outright bullish positions
July call option implied volatility is only around ~12
👉 Upside positioning remains a “lonely trade”, leaving the market vulnerable to sharp moves in either direction.
🧭 Conclusion: Tactical Caution, Structural Bull
Despite these five warning signals pointing to a near-term pullback risk, Goldman maintains its core view:
👉 The S&P 500 is likely to finish 2026 significantly higher than current levels
In this framework, any correction should be viewed as a structural buying opportunity, not a trend reversal.
Historical data supports this stance: since the Global Financial Crisis, whenever the S&P 500 Falls more than 10%, then reclaims its previous high
Average forward returns are:
+1.5% (1 week)
+5.2% (1 month)
+8.6% (3 months)