SOXX Are Falling After A Parabolic Rally: Buy The Dip Or Run Before History Repeats?
The semiconductor rally has been one of the cleanest trades in the market. But after a near-vertical move and a recent pullback, investors now face the harder question: is this the dip to buy, or the first warning that the trade has become too crowded to survive a disappointment?
Chip Stocks Are Falling After A Parabolic Rally: Buy The Dip Or Run Before History Repeats?
Semiconductor stocks are not simply strong anymore. They are historically stretched.
The AI infrastructure story has not disappeared. Demand for compute remains real, hyperscaler capex is still enormous, and the sector may still have room to run if earnings and guidance keep validating the narrative. But the trade has moved into a zone where the next 10% of upside may carry much more downside risk than investors are used to.
The core issue is not whether AI is real. The issue is whether semiconductor prices, positioning and expectations have already pulled too much future growth into the present.
The Setup Is Extreme, But Not Yet Broken
The VanEck Semiconductor ETF recently traded near $598, roughly 168% above its 50-month moving average. That is the most extreme deviation from trend among major sector ETFs.
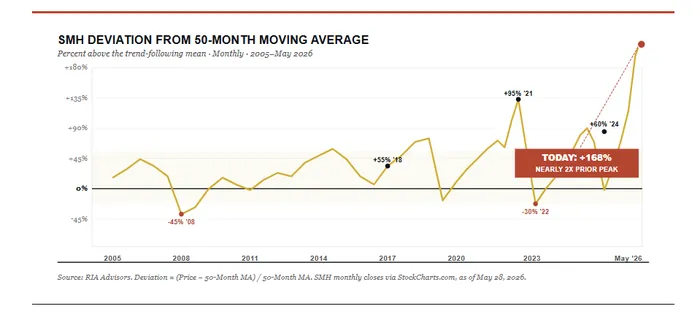
[Chart 1 Here: RIA Chart Showing SMH Relative To Its 50-Month Moving Average]
The 200-month moving average is near $88, too far below current prices to be a realistic near-term anchor, so the more useful long-term reference is the 50-month moving average near $224.
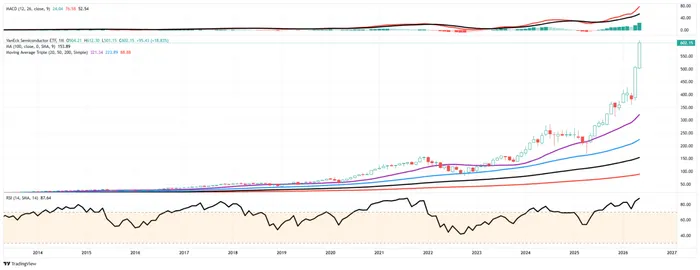
A full mean reversion from $598 to $224 would imply a decline of roughly 63%. That is not a forecast, but it shows how far the trade has moved away from its historical trend. The prior major deviation came in 2021, when the semiconductor surge reached roughly 95% above the 50-month moving average and later resolved in a 49% drawdown over the following 12 months.
Weekly technicals tell the same story. The semiconductor ETF has risen about 50% this year and about 35% since early April. By the week of May 15, it was near $560, while its 14-week RSI had closed above 80 for a second consecutive week and reached a historical high. Its price was also roughly 150% above its 200-week simple moving average, above the 100% to 108% extremes reached in 2021 and 2024.
TD Sequential has also flashed upside exhaustion, with a “red 13” signal and a risk level around $619.67. Technical resistance sits near $595, then around $619, $642 and potentially $720. Those levels do not define a top by themselves. The real question is whether momentum confirms the next move higher. If price makes a new high but RSI does not, the trade starts to look much more dangerous.
[Chart 2 Here: BofA Weekly SMH Chart With RSI, 50-Week/200-Week Averages And TD Sequential]
History Says The First Drop May Not Be The Top
Extreme overbought readings are not automatic sell signals. Since 1995, there have been seven comparable semiconductor overbought episodes. On average, after RSI moved toward 80, the final peak came about 21 weeks later. A break of key support came about 36 weeks later. The cycle low came about 73 weeks later. The average drawdown was about 44%.
That history argues against panic selling just because the sector is overbought. Strong trends can stay overbought for months. But it also argues against complacency. Once semiconductors reach this kind of extreme, the market often shifts into a more volatile phase: first a pullback, then another chase higher, then momentum divergence, then weaker high-level candles, and only later a more serious break of support.
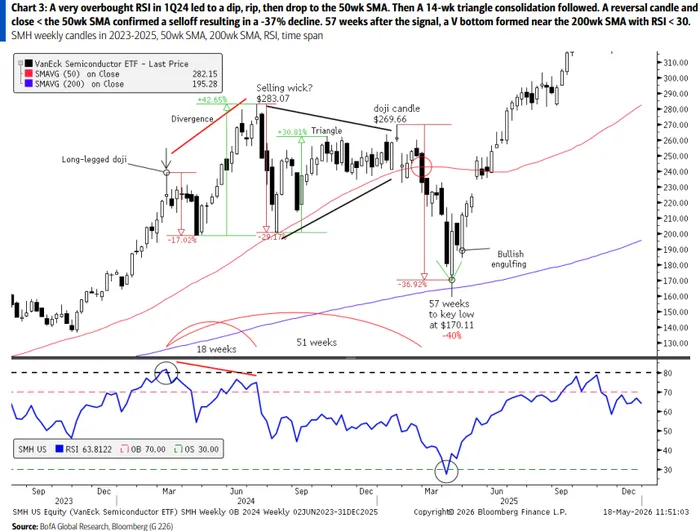
The closest roadmap may be 2024. In March 2024, weekly RSI moved above 80. The ETF first pulled back about 14% over seven weeks, but that was not the real top. Prices later rallied to new highs, while RSI failed to confirm. The actual peak came about 18 weeks after the initial signal, followed by a move toward the 50-week moving average and a drawdown of about 29%.
Even then, the cycle did not end cleanly. A later rebound of roughly 42% pulled investors back into the trade. But repeated upper shadows showed weaker buying persistence. The ETF then spent around 30 weeks in a triangle consolidation before gapping lower, breaking the 50-week moving average, and falling about 37%. The key low came near the 200-week moving average, with RSI below 30, roughly 57 weeks after the first overbought signal.
[Chart 3 Here: BofA 2024 SMH Path After RSI Above 80]
Older cycles tell the same story. In 2017, the ETF kept rising for several weeks after RSI crossed 80, then spent around 10 months in a wide trading range before forming a diamond top and breaking the 50-week moving average. The drawdown was about 26%, and the key low arrived around 61 weeks after the initial signal. In 2014, the process took even longer: an initial pullback, a new high with RSI divergence, a rising-wedge top, a break of wedge support, then a break of the 50-week moving average. The final drawdown from the 2015 high was about 27%, with key lows roughly 60 and 84 weeks after the first signal.
The 2000 cycle is the tail-risk reference. The technology story was real then too. But after RSI crossed 80, the sector soon entered a violent distribution phase with repeated 31% to 55% swings, a failed attempt to stabilize near the 200-week moving average, and an eventual peak-to-trough decline of roughly 82% to 85%. That is not the base case today, but it is the reminder: real technology revolutions can still produce brutal cyclical drawdowns.
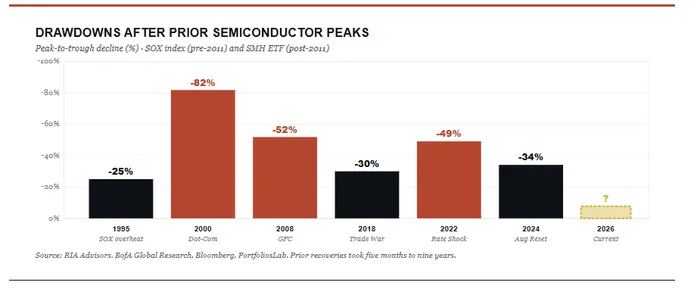
[Chart 4 Here: Semiconductor Historical Drawdowns After Parabolic Surges]
What Could Actually Break The Trade
The question is what would cause a mean-reverting event when the AI narrative still looks strong.
The first risk is customer concentration. The AI semiconductor boom depends heavily on five hyperscale buyers: Microsoft, Meta, Amazon, Google and Oracle. Their combined 2026 capital expenditure is projected above $800 billion, and the semiconductor basket is priced as if that spending can keep accelerating into 2028.
That creates a one-way dependency. The hyperscalers can slow capex if they want to protect margins, respond to investor pressure, or wait for better evidence of AI returns. Semiconductor suppliers cannot create that demand in reverse. They rely on those customers continuing to spend aggressively.
The catalyst does not need to be a collapse in AI. It could be much smaller: one hyperscaler moderating capex guidance, delaying orders, or suggesting that the next phase of AI infrastructure spending will be more measured. If that happens, the bid under the semiconductor complex can fade quickly.
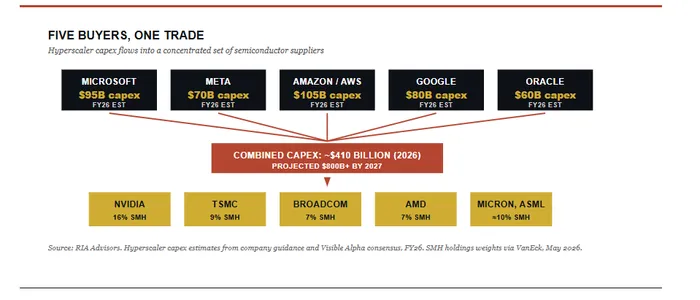
[Chart 5 Here: The Five Main Buyers For Semiconductors]
The ETF also looks less diversified than it appears. More than half of the exposure is tied to a small group of major suppliers that all depend on the same hyperscale customers. So while the basket contains many tickers, the underlying demand exposure is highly correlated. If hyperscaler capex slows, the basket can move as one trade.
Positioning makes that risk more fragile. Long global semiconductors has been identified as the most crowded trade on Wall Street, with a record 73% reading. Crowded trades can keep rising, but they become vulnerable when the narrative shifts. Once everyone is already on the same side, the marginal buyer becomes harder to find.
Gamma has also helped make the move vertical. Retail and momentum traders have piled into short-dated calls on the major semiconductor winners and the ETF itself. Dealers who sell those calls hedge by buying the underlying stocks as prices rise. That buying pushes prices higher, which forces more hedging, which attracts more momentum. The feedback loop works beautifully until call buying stalls, options expire, or a catalyst interrupts the trade.
The problem is that the mechanism works in reverse. If prices fall and call exposure unwinds, dealer hedging can turn from forced buying into forced selling. If put buying rises at the same time, dealers can become short put gamma and may need to sell more as prices fall. The August 2024 unwind is the warning: the ETF fell about 34% in roughly six weeks even though the AI demand story had not collapsed.
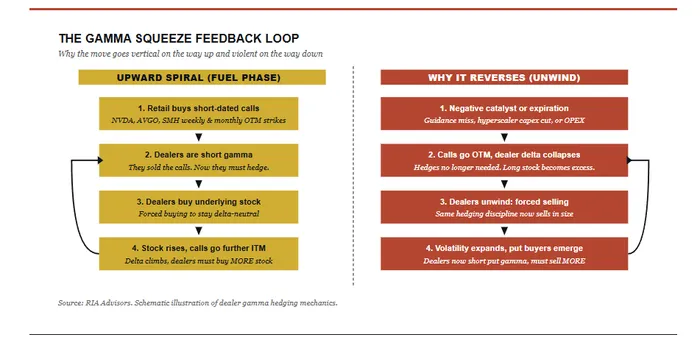
[Chart 6 Here: Gamma Feedback Loop]
Near-term earnings catalysts matter more in this setup. The market is not just looking for strong numbers. It is looking for management teams to extend AI revenue visibility into harder targets. Strong results with cautious forward guidance could still disappoint. If earnings arrive alongside softer hyperscaler capex commentary, the trade could reprice faster than fundamentals alone would suggest.
Buy The Dip Or Run?
There is still no confirmed top. That matters.
Shorting a parabolic semiconductor move outright can be dangerous because the final leg can run further than expected. The better framework is to watch for confirmation signals. The first is price-RSI divergence: if the ETF makes a new high but 14-week RSI does not, the rally starts to resemble prior topping structures. The second is weak high-level candle quality: long upper shadows, long-legged doji candles, bearish engulfing patterns and outside reversal weeks. The third is the 50-week moving average. Pullbacks to that level are not automatically fatal; the real warning is a break below it followed by a failure to reclaim it.
For long-term investors, the secular AI infrastructure thesis may still be intact. Compute demand is real, and semiconductors remain strategically important. But secular themes can still suffer 30% to 50% cyclical drawdowns. Internet adoption was real in 2000. That did not protect investors who bought leading infrastructure stocks at the peak.
For investors already long, the question is not whether to abandon the theme. It is whether to keep carrying the same exposure after the trade has moved into an unfavorable asymmetry. Trimming is not necessarily a bearish call. It can simply be risk management.
For investors waiting to enter, the risk is chasing after the trade has become technically extreme, positionally crowded and structurally dependent on a small number of buyers. The better opportunity may come after volatility resets expectations and support levels are tested.
The practical playbook is not “short semiconductors.” It is “manage the asymmetry.” That can mean tightening trailing stops, trimming positions that have moved far above target weight, waiting before adding new cash, or buying downside protection before volatility spikes. Option structures can also help, such as selling out-of-the-money calls to finance protective puts, preserving some upside while reducing the risk of a violent unwind.
The semiconductor rally may not be over. History actually suggests the first pullback after an extreme overbought signal often is not the final top. The sector could still push higher if momentum confirms and earnings catalysts cooperate.
But the trade is now stretched across almost every risk dimension: moving-average deviation, RSI, customer concentration, crowded positioning and gamma-driven upside. That does not mean investors should panic. It does mean the trade should no longer be treated as low-risk momentum.